Tools · Analyze
Solana Network Status: Live TPS, Fees and Slot
Live TPS, priority fees, current slot, epoch and RPC version.
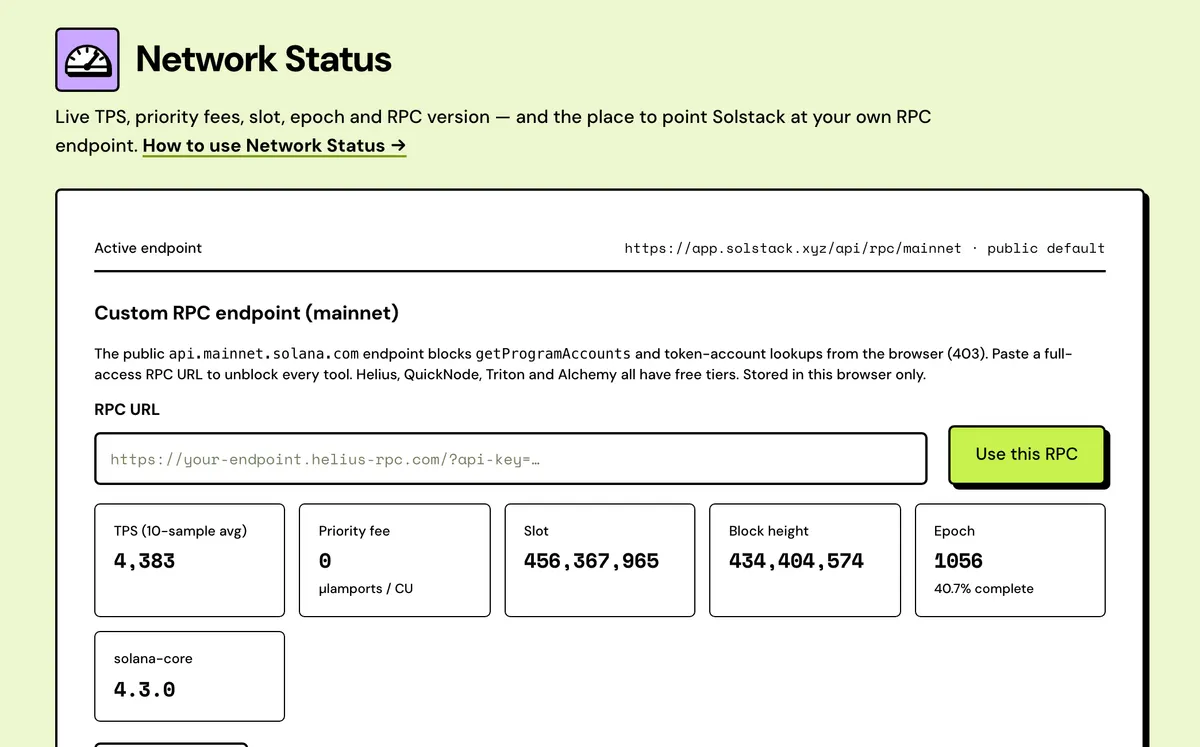
How to use the Solana Network Status
- Open the page.
- Read live TPS, priority fees, slot and epoch.
- Refresh anytime for the current numbers.
- TPS
- Priority fee
- Slot and block height
- Epoch progress
- Node version
- Your RPC endpoint
FAQ
What is TPS?
Transactions per second over recent samples, including votes.
What's a priority fee?
A tip per compute unit, in micro-lamports. The figure here averages the lowest non-zero fee that landed in each recent slot.
Why do numbers differ from other dashboards?
Different RPC, different window.
Can I use my own RPC?
Yes. Paste its URL here and every Solstack tool on that network uses it, in this browser only.
How often does it refresh?
Every 30 seconds while the page stays open. Refresh now updates it on demand.
Does it need a wallet?
No.
What does a stalled slot mean?
The RPC endpoint has fallen behind the network. Try again shortly, or switch to your own RPC.
How long is an epoch?
432,000 slots, which at current slot times of about 0.2 seconds is a little over a day.
Everything about the Solana Network StatusFeatures in full, how it compares, costs and the complete guide
What Network Status measures
TPS
Transactions per second over the last 10 performance samples, roughly the last 10 minutes, with validator vote transactions included.
Priority fee
Recent per-slot priority fees in micro-lamports per compute unit, averaged. Slots where no priority fee was paid are left out.
Slot and block height
Both read live from the endpoint. Block height runs behind the slot number because skipped slots produce no block.
Epoch progress
The current epoch number and the share of its slots already passed, as a percentage.
Node version
The solana-core version reported by the RPC node answering you, useful when one endpoint behaves differently from another.
Your RPC endpoint
Shows the endpoint in use, marked public default or custom, and lets you switch every Solstack tool on that network to your own.
Solstack vs a Solana network dashboard
Dashboards describe the whole network; this checks the endpoint your tools actually talk to.
Solstack Network Status
- Measures the RPC endpoint your Solstack tools use, and shows its URL
- Switch every Solstack tool on that network to your own RPC from this page
- Priority fee as a price per compute unit, the unit wallets and SDKs set
- Shows the solana-core version of the node answering you
Typical network dashboard
- Usually measures from the site's own nodes, so a lagging endpoint of yours doesn't show
- Display only; a custom RPC, where offered, changes only what that site reads
- Fees, where shown, usually as SOL or USD per transaction or per minute
- Usually no version for the node serving the numbers
Solana Network Status: Complete Guide
What Network Status measures
A quick read on how the network is doing right now: transactions per second over recent samples, the current average priority fee in micro-lamports per compute unit, the current slot and epoch, and the RPC node's own version.
Numbers will differ from other dashboards since every RPC and sampling window is a little different — this is a snapshot, not a canonical source.
When to check it
Before you blame your wallet for slow, failing or expiring transactions, check here. Falling TPS or a spike in the priority fee points to a busy network. A slot that stops climbing between refreshes means the RPC endpoint you're using has fallen behind.
Reading the numbers
- TPS: an average over the last 10 performance samples. Vote transactions count too, which is why it reads higher than dashboards that only count user transactions.
- Priority fee: the average of the lowest non-zero fee that landed in each recent slot, in micro-lamports per compute unit. The higher it is, the busier the network.
- Slot and block height: both should keep rising.
- Epoch: which one the network is in and the progress through it. Each is 432,000 slots, a little over a day at current speeds.
- solana-core: the version of Solana's software the RPC node is running.
Using your own RPC
The page also shows which RPC endpoint this browser uses for the selected network. Paste a full-access RPC URL from a provider such as Helius, QuickNode, Triton or Alchemy and every Solstack tool on that network reads and sends through it. It's stored in this browser only, and Reset to public switches back. It's worth doing when big scans in the Solana Token Holder Snapshot or the Solana Smart Money Tracker hit the default endpoint's limits.
Why other dashboards differ
Every dashboard reads from its own RPC node over its own sample window, and some leave out validator vote transactions. So TPS here can be higher than on a site that counts only user transactions, and the priority fee is a recent average rather than a quote for your next transaction. Use it to see whether the network is normal or busy right now, not as a canonical figure.
Devnet or mainnet
The readout follows the network picked in the top bar, so you can check devnet before a rehearsal and mainnet before the real thing. A custom RPC is set separately for each network.
Where each number comes from
Every figure is a standard Solana RPC call to the endpoint shown at the top, repeated every 30 seconds.
| Number | RPC call | What to know |
|---|---|---|
| TPS | getRecentPerformanceSamples | 10 samples of about 60 seconds each; votes are counted |
| Priority fee | getRecentPrioritizationFees | Each recent slot's lowest landed fee, up to 150 slots, averaged over non-zero slots |
| Slot | getSlot | Should be higher on every refresh |
| Block height | getEpochInfo | Trails the slot, since skipped slots have no block |
| Epoch | getEpochInfo | Progress is slots passed out of slots in the epoch |
| solana-core | getVersion | Software version of the node answering |
Slots, blocks and epochs today
- An epoch is 432,000 slots.
- On 2026-10-16 Solana Explorer showed a one-hour average slot time of 215 ms, which makes an epoch roughly 26 hours.
- On the same day the slot was about 457.6 million and the block height about 435.7 million. The gap is every slot whose leader produced no block.
- For what confirmed, finalized and failed mean for a transaction, see the transaction lifecycle.
What it costs
Free.